Scope 3 Carbon Emissions: Seeing the Full Picture
Global investors are increasingly looking to identify opportunities to mitigate climate risks and support the transition to a world of net-zero emissions. One gap in their knowledge is how to tackle emissions from the value chain of the companies in which they invest. In this blog post, MSCI explain what these emissions are, why they are so important and what action investors can take to manage such risks.

- A company’s Scope 3 carbon emissions include everything beyond its direct operations and electricity use, including supply-chain operations and end-product usage by customers. Regulators are increasingly focusing on Scope 3.
- The state of Scope 3 reporting is poor. A detailed estimation model can help highlight potential climate-transition risks for investors in companies’ upstream and downstream in the value chain.
- A big enough dataset makes it possible to alleviate concerns about possible “double counting” of emissions across an investment portfolio.
Global investors are increasingly looking to identify opportunities to mitigate climate risks and support the transition to a world of net-zero emissions. One gap in their knowledge is how to tackle emissions from the value chain of the companies in which they invest. In this blog post, we explain what these emissions are, why they are so important and what action investors can take to manage such risks.
What Are Scope 3 Emissions and Why Are They So Important?
Investors concerned about climate change have traditionally focused on Scope 1 and Scope 2 emissions — e.g., the direct emissions from an oil- and gas-refining operation (Scope 1) and the emissions from the electricity utility needed to run the refinery (Scope 2). With businesses, governments and investors increasingly focused on a net-zero transition, Scope 3 investment risks are mounting. These risks may come from new regulation of a company’s high-emission products and shifts in end-product market demand driven by climate concerns.
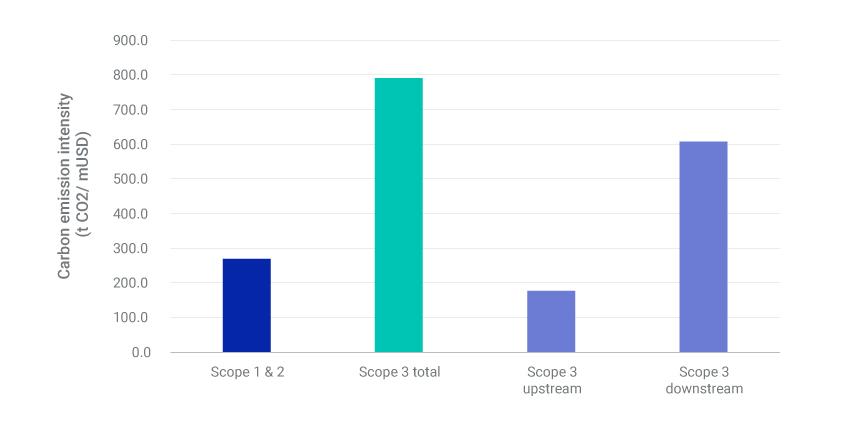
For some companies and industries, Scope 3 emissions dominate the overall carbon footprint. For example, the Scope 3 emissions of the integrated oil and gas industry (measured by the constituents of the MSCI ACWI Index) are more than six times the level of its Scope 1 and 2 emissions. This may be true for the carbon footprint of an investment portfolio as well. In the exhibit below, we can see that the total Scope 3 average intensity was almost three times greater than the combined Scope 1 and 2 intensity as of July 2020.
Average Scope 1 & 2 vs. Scope 3 Carbon Emission Intensity for MSCI ACWI IMI
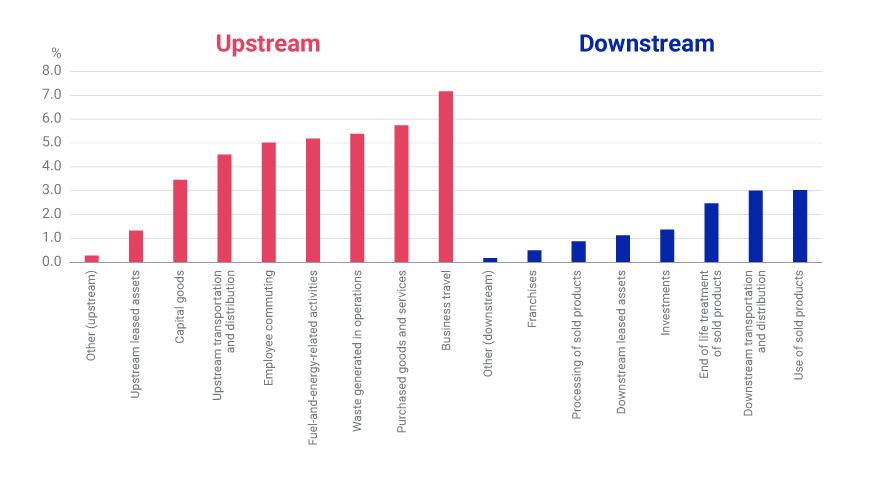
Understanding Scope 3 emissions is more complex than comprehending Scope 1 and 2. Corporate reporting on Scope 3 emissions remains sparse, incomplete and at times highly volatile, posing challenges for institutional investors who aim to consider broader value-chain climate risks in their climate-related risk management and portfolio-construction practices. As of March 2020, only 18% of constituents of the MSCI ACWI IMI reported Scope 3 emissions. We find even lower percentages of Scope 3 reporting when we look at the individual Scope 3 categories.1
Share of Companies Reporting Emissions in Each Scope 3 Category
To tackle the Scope 3 disclosure challenge, we developed a model to estimate these emissions across each of the 15 categories using a combination of revenue estimates and production data. The exhibit below highlights the exposure of each sector Global Industry Classification Standard (GICS®2) sector to each category of Scope 3 emissions, providing insights into the potential risks facing each sector and the location of these risks within their upstream or downstream value chain.
Estimated Scope 3 Emissions Per Category for Each GICS Sector
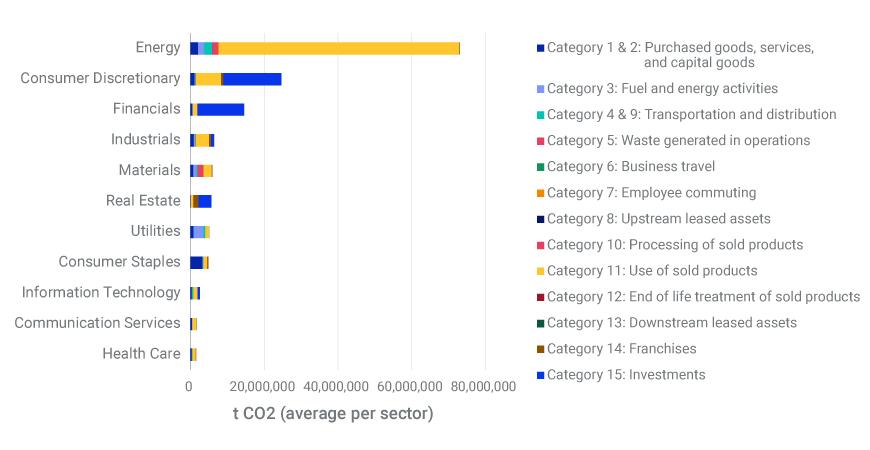
MSCI ACWI IMI constituents. Data as of July 10, 2020. Source: MSCI ESG Research LLC
Avoiding Double Counting
Some investors have been concerned about the possibility of double counting if they were to incorporate Scope 3 emissions into their portfolio carbon footprinting. For example, if an oil and gas company sells all of its fuel to a mining company, and this mining company uses only this company’s products to run its mine, the downstream Scope 3 emissions of the oil and gas company should essentially be equivalent to the mining company’s Scope 1 emissions. If both the oil and gas company and mining company were in the same portfolio, a comprehensive carbon footprint might count these emissions twice, thereby overstating the carbon footprint of the entire portfolio.
One way around this problem is to use “de-duplication multipliers.” If you have a big enough dataset (i.e., a universe encompassing thousands of companies), it is possible to estimate the amount of would-be duplicated emissions across a portfolio and adjust for it. By looking at the roughly 12,000 companies in our master climate-risk dataset, we were able to calculate a de-duplication multiplier of approximately 0.205. When applied, the multiplier results in a figure closer to the actual carbon footprint.
Understanding Where the Risks Lie
Investors seeking to measure their exposure to Scope 3 emissions face a big challenge: data is scarce and inconsistent. A detailed Scope 3 estimation model can help fill in the gaps in companies’ carbon-emission reporting, while avoiding the pitfalls of possible double counting when applied across a portfolio. This type of detailed information may enhance investors’ view of where carbon-transition risks lie across their portfolios.
For more information please click here.


_400_250_s_c1.png)