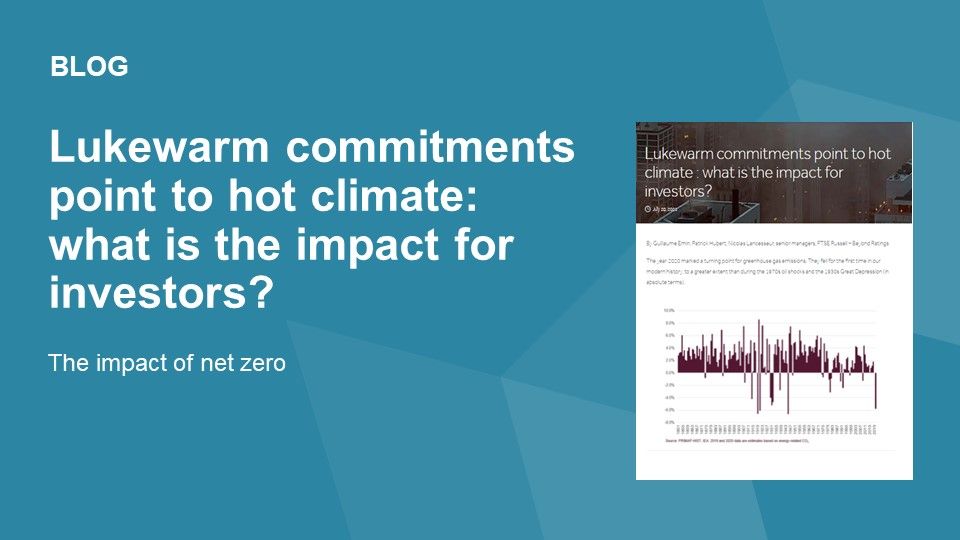
Lukewarm commitments point to hot climate: what is the impact for investors?
The year 2020 marked a turning point for greenhouse gas emissions. They fell for the first time in our modern history, to a greater extent than during the 1970s oil shocks and the 1930s Great Depression (in absolute terms).
The year 2020 marked a turning point for greenhouse gas emissions. They fell for the first time in our modern history, to a greater extent than during the 1970s oil shocks and the 1930s Great Depression (in absolute terms).
Annual evolution of global greenhouse gas (GHG) emissions (excluding land use)
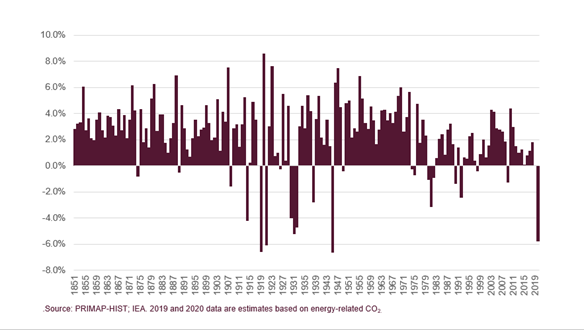
The bad news, however, is that it took a pandemic and widespread economic shutdowns to depress fossil fuels consumption; it didn’t last, as by December 2020, global CO2 emissions returned to their pre-crisis uptrend; and it highlighted that for global warming to stay under 1.5°C, emissions need to decrease again by roughly 6% vs the previous year, and this should be repeated every year in the next decades.
The 2015 Paris Agreement (COP21) committed all countries to limit global temperature rise to “well below 2°C.” On ratification, countries submitted a first commitment to reduce GHG emissions via their respective “Nationally Determined Contributions” (NDC). Thereafter, a general review conducted with civil society and experts is scheduled every five years, where countries revise their commitments and submit new, more ambitious NDCs.
The first revision should conclude by November 2021 (COP26, to be held in Glasgow). This is a decisive test for the agreement and its ability to make countries converge towards the long-term objective. In April 2021, the US President Biden hosted a “Leaders Summit on Climate,” precisely to galvanize the NDCs revision process prior to COP26. Despite these initiatives, our calculation of current NDC commitments’ implied rise remains well above 2°C.
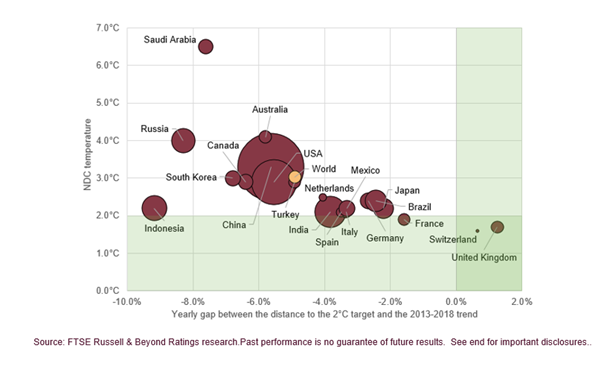
Our methodology (detailed in How to measure the temperature of sovereign assets) measures a country’s distance to the 2°C target. A main outcome of our analysis is that, at global level, the overall implied temperature of updated NDCs—post the NDC updates in recent months—is pointing toward a 2.9°C warming by the end of the century (see graph below)[1]. It is therefore critical that the collective efforts to reduce emissions improve significantly in the coming months and during COP26.
Countries provide details on NDCs’ implementation to limit emissions: the main sectoral and technological options are well known, and the UN Environment Programme Emissions Gap Report 2020 has identified (by sector), the major long-term transformations needed to reach net-zero GHG emissions globally, including:
- Full decarbonization of Energy,
- Shifts in Industry processes towards electricity and zero carbon,
- Decarbonization of Transport and modal shifts to alternative transportation,
- Energy efficiency and electrification for the Building sector,
- Enhanced land management in Agri-food, as well as dietary shifts and food waste reduction,
- Halting deforestation and adopting policies to improve Land use capacity for net CO2 uptake.
However, to initiate these shifts and shine light on the transition pathway for investors, rules and regulations are needed. Notwithstanding 2020-style global pandemic shutdowns, for policy makers there are three main types of instruments available to help them drive the transition:
- carbon pricing (via a tax or an emissions allowances market)
- subsidies to low-carbon solutions, and/or
- standards and regulation (emissions standards, technology bans, etc.)
Each instrument implies costs for some economic actors (financing subsidies, investing to comply with standards, etc.) bearing an “implicit” carbon price. If well-calibrated, all these instruments result in less GHG emissions, and lower associated economic damages. They can all impact asset valuations and have implications for investors, although in different ways.
The combined national policies already signal that a massive capital reallocation is going to be required: for investors, that tectonic shift presents both risks and opportunities.
Moving activities towards net-zero will mobilize every sector. If NDC commitments stretch to limiting warming to 1.5°C, the IPCC anticipates that a marked shift in investment patterns would be necessary. Additional annual average energy-related investments for the period 2016 to 2050 are estimated to be around US$ 830 billion. The green economy (with segments such as batteries, renewable energy equipment, public transportation solutions, recycling services, buildings’ renovation materials, or efficiency management goods and services) will play a central role and calls for increased investments.
Conversely, one could expect pure-play fossil fuel operators to face dimmer prospects if adoption of low-carbon products becomes widespread. In a 1.5°C trajectory, the stranding of fossil fuels assets would be a distinct possibility. The IEA’s scenarios’ projections, in the 2020 World Economic Outlook, provided estimated present value of future oil and natural gas production to 2040. Due to lower prices and expected future demand, the shock of the COVID-19 pandemic has implied a strong decrease in that present value—from US$23 trillion to US$18 trillion. In their assessment, a Paris-aligned scenario would further decrease such value to US$12 trillion.
We have only just seen the tip of the iceberg of the impacts that a 1.5°C or 2°C transition scenario would have on investment activities in relation to risk management, asset prices and investment strategies. This calls for urgent action from investors to prepare for the changes involved.
[1] Note: The X-axis measures a 2°C trend alignment based on the gap between the projected compounded annual growth rate. aligned with the 2°C target (distance to the 2°C target) and the recent GHG emissions CAGR (based on the 2013-2018 period). A positive gap means that the historical trend is consistent with a 2°C trajectory. The bubble size is proportional to the volume of territorial GHG emissions in 2018 (including LULUCF) ‒ except for the World bubble.
To learn more about FTSE Russell click here.
© 2021 London Stock Exchange Group plc (the “LSE Group”). All information is provided for information purposes only. Such information and data is provided “as is” without warranty of any kind. No member of the LSE Group make any claim, prediction, warranty or representation whatsoever, expressly or impliedly, either as to the accuracy, timeliness, completeness, merchantability of any information or of results to be obtained from the use of FTSE Russell products or the fitness or suitability of the FTSE Russell products for any particular purpose to which they might be put. Any representation of historical data accessible through FTSE Russell products is provided for information purposes only and is not a reliable indicator of future performance. No member of the LSE Group provide investment advice and nothing contained in this document or accessible through FTSE Russell products should be taken as constituting financial or investment advice or a financial promotion. Use and distribution of the LSE Group data requires a licence from an LSE Group company and/or their respective licensors.