Not everyone’s a winner: mitigating climate and inflation risk
There is a lively debate among economists and central banks about the extent to which climate change is inflationary. Where does this leave investors concerned about addressing both climate and inflation risk in sovereign bond markets? Read the FTSE blog.
Market expectations for a global economic recovery and fiscal stimulus have spurred heightened inflation expectations—making inflation protection a priority for many investors. Meanwhile, climate risk has also emerged as a key risk consideration in recent years, with asset owners naming it as their top sustainability theme in our recent survey. There is a lively debate among economists and central banks about the extent to which climate change is inflationary, but, more practically, where does this leave investors concerned about addressing both climate and inflation risk in sovereign bond markets?
A tale of two risks
Fiscal and monetary policy changes in response to the pandemic have been significant, with unprecedented stimulus programs and an extended era of quantitative easing. And as the COVID-19 vaccine rollout gathers pace, many market participants are expecting the economy will soon reopen, giving rise to robust demand when supply chains are still facing pandemic-related shortages.
All of these factors are driving heightened inflation expectations. The US five-year breakeven inflation rate—which implies what market participants expect inflation to be in the next five years—has skyrocketed over the past year, surging from its low of 0.16 in March 2020 to 2.57 on April 16, 2021.[1]
Simultaneously, investors are growing increasingly aware of the potential impacts of climate change on their investments. As countries around the globe transition to a low carbon economy, exposure to fossil fuel reserves, carbon emissions, and other climate-related natural disasters can introduce material risks to investors. There is a hunger to address the double-whammy of inflation and climate impact.
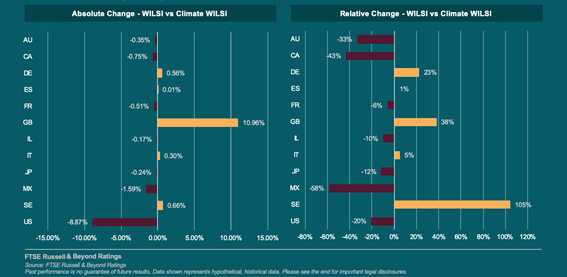
These risks are illustrated by comparing the FTSE Climate Risk-Adjusted World Inflation-Linked Securities Index (FTSE Climate WorldILSI)—a sovereign inflation-linked bond index with an amended climate risk profile—with our market value-weighted benchmark. the FTSE World Inflation-Linked Securities Index (FTSE WorldILSI). As well as providing its parent’s inflation-hedging capabilities, the climate version fares materially better with respect to both GHG emissions and alignment with the 2 degree targets set forth by the Paris Agreement.
Note: we addressed both inflation and climate risk in a single index by applying a tilting methodology to adjust index weights to each country’s relative exposure to climate risk in the FTSE World Inflation-Linked Securities Index (FTSE WorldILSI).
Countries and climate risk: The winners and the losers
Country weights in the index are determined by assigning country climate scores, derived through an assessment of each country’s relative climate risk across three core pillars—transition risk, physical risk, and resilience. Countries are scored across each of these pillars to comprise a single combined score, which is then used to reweight the country’s exposure in the index.
The outcome of this methodology is an index with higher exposures to countries that are more resilient to climate change risks and lower exposures to countries that are more exposed to climate change risks. As shown below, this approach materially changes the country weight composition relative to the market value weighted index.
Note: we addressed both inflation and climate risk in a single index by applying a tilting methodology to adjust index weights to each country’s relative exposure to climate risk in the FTSE World Inflation-Linked Securities Index (FTSE WorldILSI).
These charts illustrate how the largest absolute weight change comes from overweighting the UK and underweighting the US. This is primarily due to poor transition risk performance in the US, where the country is lagging others with respect to historic trends in carbon emissions and future carbon reduction needed to meet 2 degree alignment.
Given the large initial market value weights of the UK and the US, the climate-adjusted version of the index effectively redistributes weight changes between these two countries. Other noteworthy climate risk winners and losers are Sweden, whose weighting increases by 105%, and Mexico, whose weighting is down by 58%.
The race is far from over
This methodology for weighting countries in the index also sheds light on where countries stand in their progress toward transitioning to low carbon economies.
It’s important to note that our index methodology allows for countries to change trajectories on their paths toward 2-degree alignment, as we update country scores annually each June and reweight accordingly. Thus, while we found the US to be notably more exposed to climate risk than the UK, there is time yet to make up lost ground. Some promising recent trends—such as the Biden administration’s renewed commitment to green initiatives and large US asset managers investing in a net zero transition—could help improve the country’s climate risk profile.
[1] Source: Federal Reserve Bank of St. Louis
To learn more about FTSE Russell click here.
© 2021 London Stock Exchange Group plc (the “LSE Group”). All information is provided for information purposes only. Such information and data is provided “as is” without warranty of any kind. No member of the LSE Group make any claim, prediction, warranty or representation whatsoever, expressly or impliedly, either as to the accuracy, timeliness, completeness, merchantability of any information or of results to be obtained from the use of FTSE Russell products or the fitness or suitability of the FTSE Russell products for any particular purpose to which they might be put. Any representation of historical data accessible through FTSE Russell products is provided for information purposes only and is not a reliable indicator of future performance. No member of the LSE Group provide investment advice and nothing contained in this document or accessible through FTSE Russell products should be taken as constituting financial or investment advice or a financial promotion. Use and distribution of the LSE Group data requires a licence from an LSE Group company and/or their respective licensors.