Taking the temperature of sovereign bond portfolios
Climate-related risks have been front and center for equity investors for some time—there has been growing pressure to align investments to avoid loss or even optimize opportunities related to the impact of climate change.

Climate-related risks have been front and center for equity investors for some time—there has been growing pressure to align investments to avoid loss or even optimize opportunities related to the impact of climate change. But now the same spotlight is on physical and transition risks in fixed income portfolios, including sovereign bonds.
Sovereign bonds are a bedrock of asset allocations by pension funds. One of the largest asset classes in the world, it is estimated that the overall sovereign bonds market size totals $87.5 trillion—so, detailed climate risk analysis benefits both risk managers and addresses climate change.
A key component of measuring climate impact is the temperature trajectory of a portfolio on a 2100 horizon versus a maximum 2°C global target increase. This is consistent with the 2015 Paris Agreement[1], IPCC scenario reporting[2], NDC targets[3] and Deep Decarbonisation Pathways Project[4]. Any approach needs to assess climate risk exposure from a number of viewpoints, addressing both transition risk—such as underlying drivers of emissions, the share of energy consumption from green versus brown sources, and physical risk scores incorporating climate risk issues such as sea level exposure.
The first key metric is understanding the temperature trajectory of a sovereign bond portfolio, given that all the sovereigns within have different GHG emission levels and different abilities to realistically reduce these over the coming decades. These trajectories—which use Beyond Ratings’ CLAIM model—provide a forward-looking, purely quantitative metric for assessment of transition risk. This enables comparison of investment choices at a bond and portfolio level to achieve the lowest carbon impact and alignment to commonly referenced goals such as the 2°C increase in the 2015 Paris Agreement.
For example, we can see that the WGBI has a temperature trajectory of 3.9°C by 2100, but the Climate risk-adjusted WGBI improves on this by 5% with a temperature trajectory of 3.7°C. The European Monetary Union GBI (EMUGBI) improves on this even further, with an estimated 2.5°C temperature increase by 2100.
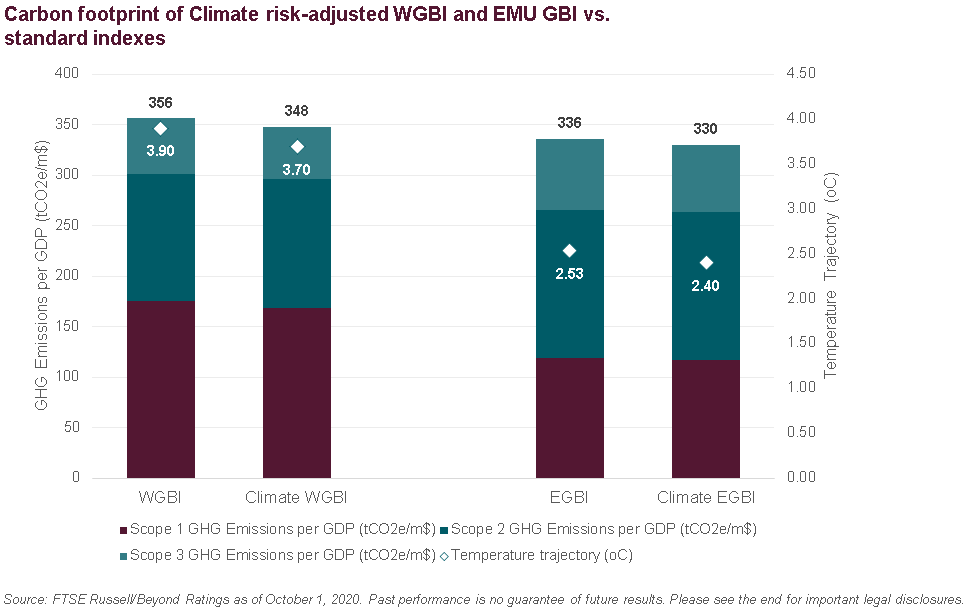
We can also measure the climate impact through the level of GHG emissions, normalized per unit of GDP to be able to compare across countries. These metrics allow us to examine energy reliance of a country’s economy through the analysis of territorial, imported and exported CO2 emissions and allows firms to compare country performance as well as aggregate results at a portfolio level.
These measures, as well as the rest of the suite of metrics available, are aligned to Taskforce for Climate-related Financial Disclosures (TCFD)[5] definitions, and include equivalents for the GHG Protocol-defined Scope 1, 2 and 3 GHG emissions. This supports firms in fulfilling reporting requirements to regulators, clients and to satisfy internal mandates.
To learn more about FTSE Russell click here.
[1] https://unfccc.int/process-and-meetings/the-paris-agreement/the-paris-agreement
[3] https://unfccc.int/process-and-meetings/the-paris-agreement/the-paris-agreement/nationally-determined-contributions-ndcs#:~:text=Nationally%20determined%20contributions%20(NDCs)%20are,the%20impacts%20of%20climate%20change.
[4] http://deepdecarbonization.org/
© 2020 London Stock Exchange Group plc (the “LSE Group”). All information is provided for information purposes only. Such information and data is provided “as is” without warranty of any kind. No member of the LSE Group make any claim, prediction, warranty or representation whatsoever, expressly or impliedly, either as to the accuracy, timeliness, completeness, merchantability of any information or of results to be obtained from the use of FTSE Russell products or the fitness or suitability of the FTSE Russell products for any particular purpose to which they might be put. Any representation of historical data accessible through FTSE Russell products is provided for information purposes only and is not a reliable indicator of future performance. No member of the LSE Group provide investment advice and nothing contained in this document or accessible through FTSE Russell products should be taken as constituting financial or investment advice or a financial promotion. Use and distribution of the LSE Group data requires a licence from an LSE Group company and/or their respective licensors.